
Charts and Infographics
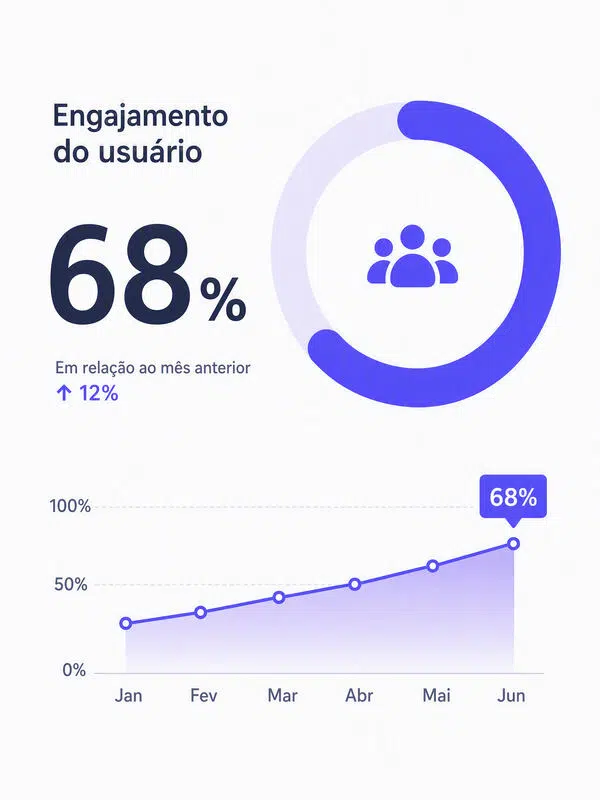
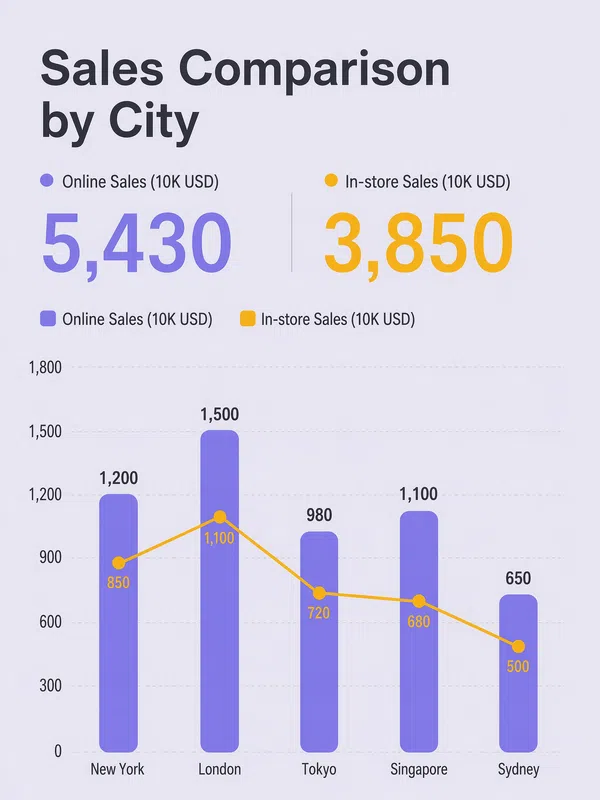
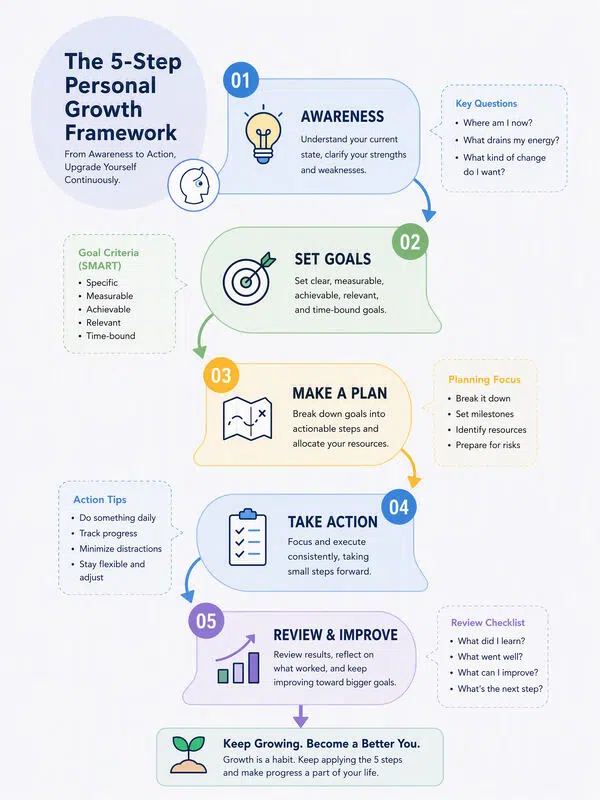
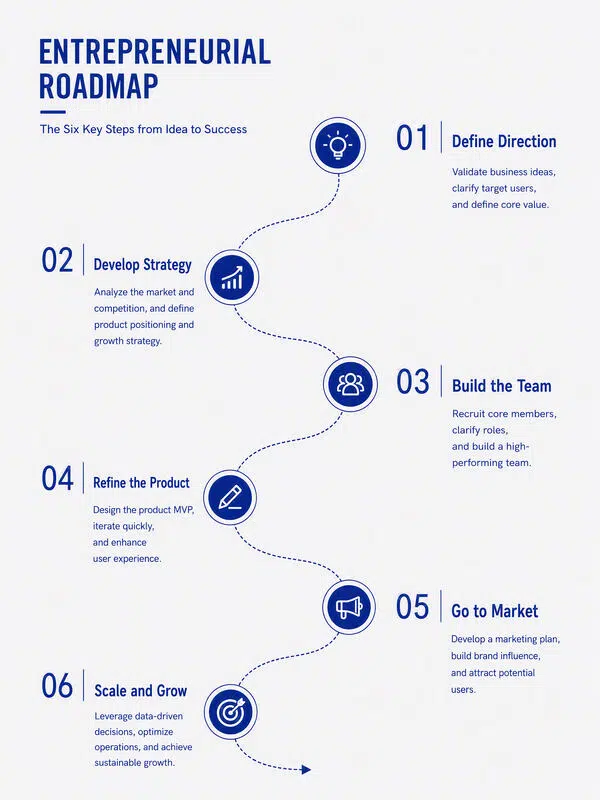
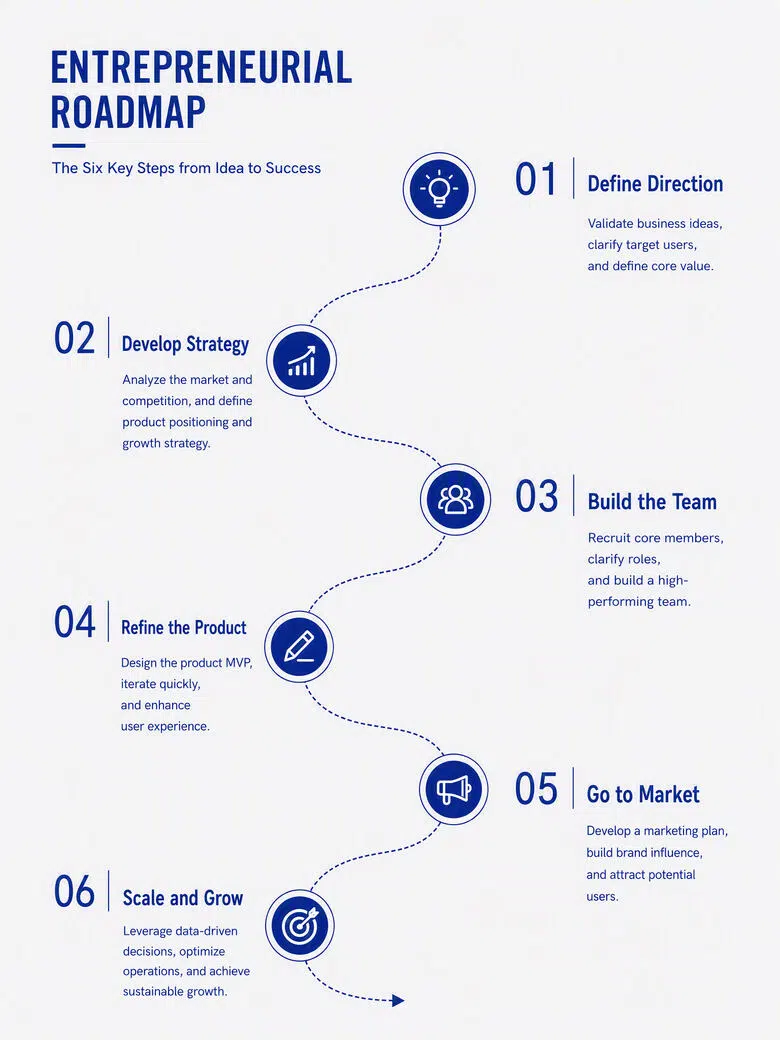
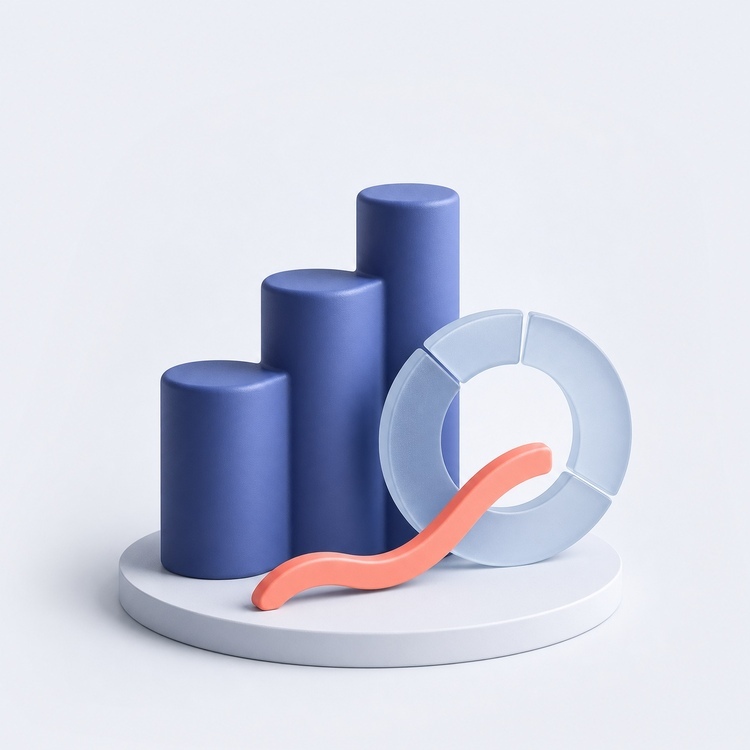
Create data visualizations and infographics. Provide the source material and key settings, then generate ready-to-use results for business communication, presentation, and delivery in minutes.
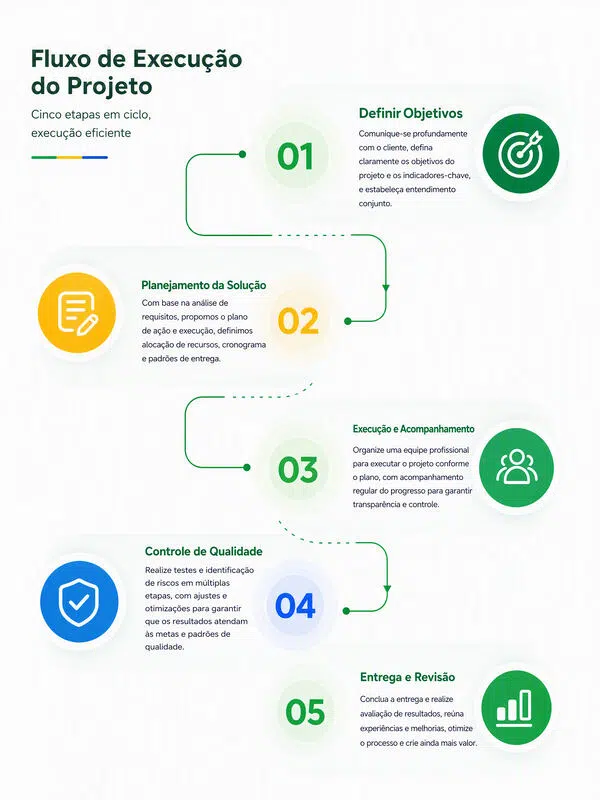
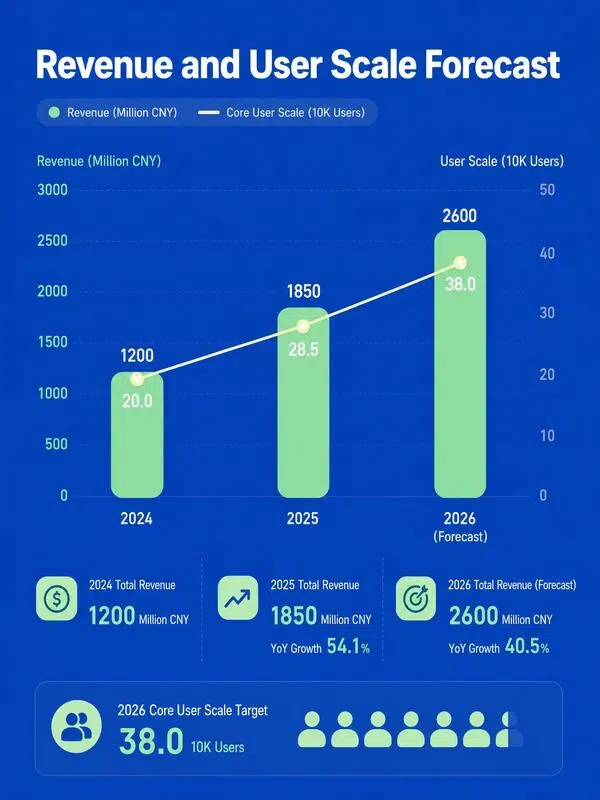
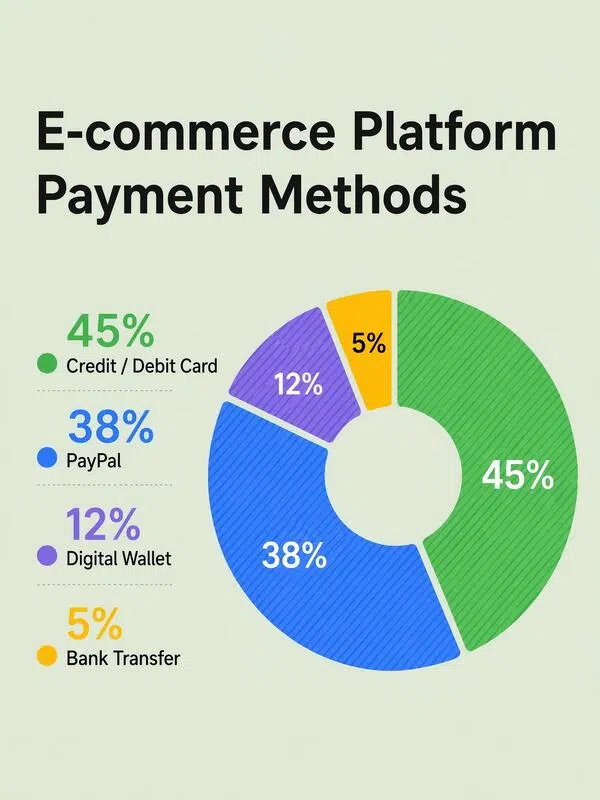
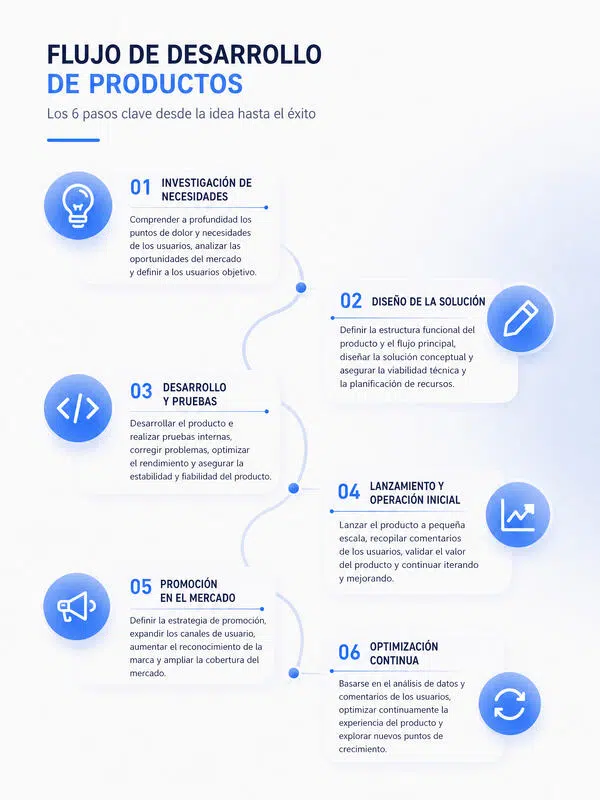
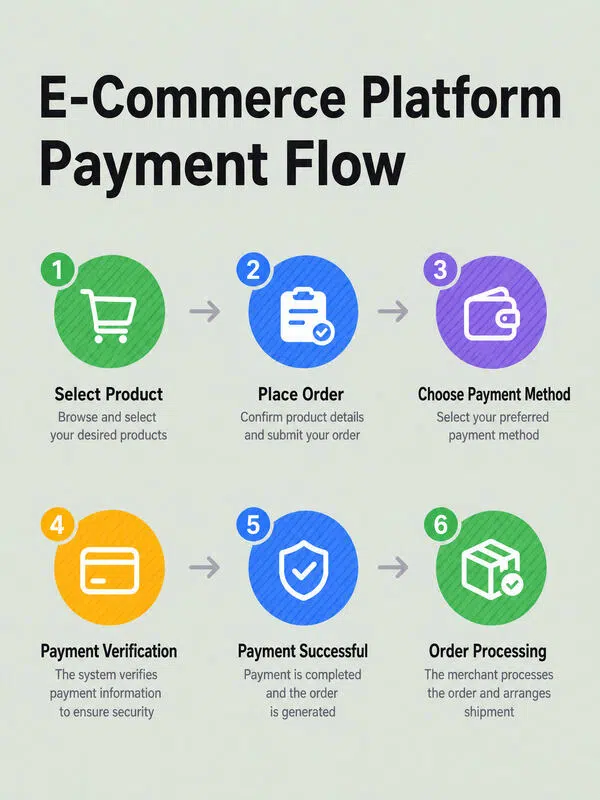
How to Use AI Charts and Infographics
Prepare your materials and brief
Upload relevant files or enter the key information needed for the task.
Set your generation preferences
Choose the format, style, quantity, and other settings that match your intended use.
Generate and keep editing
Generate a first version, then continue editing and refining it for use.
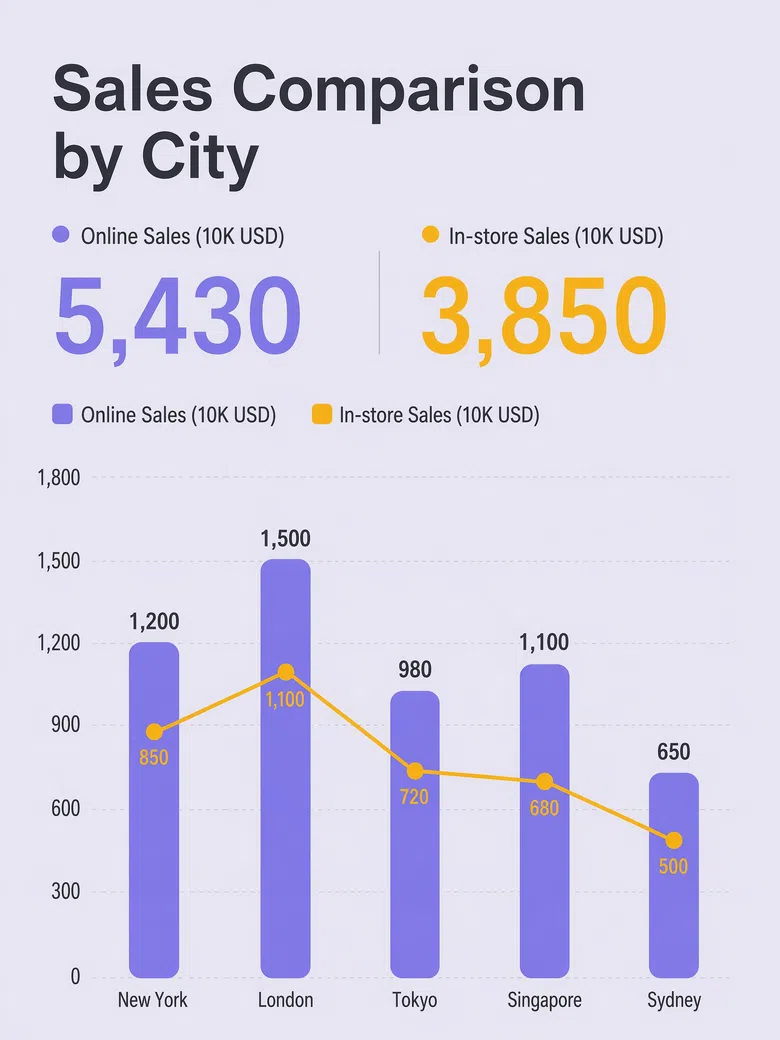
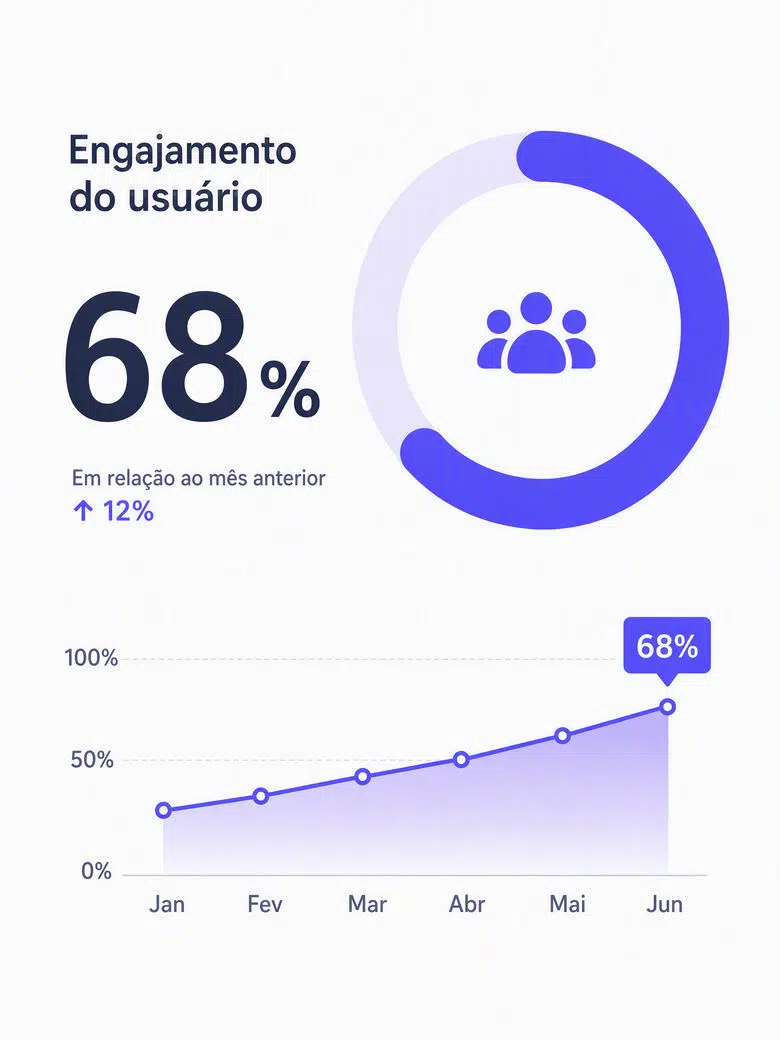
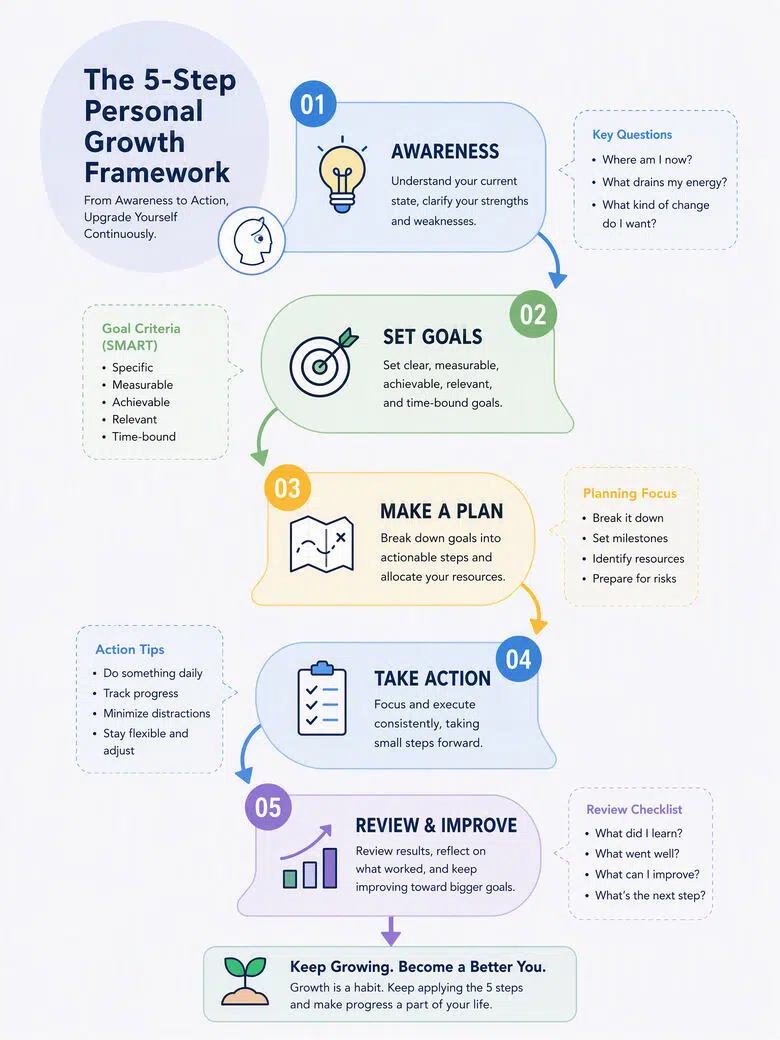
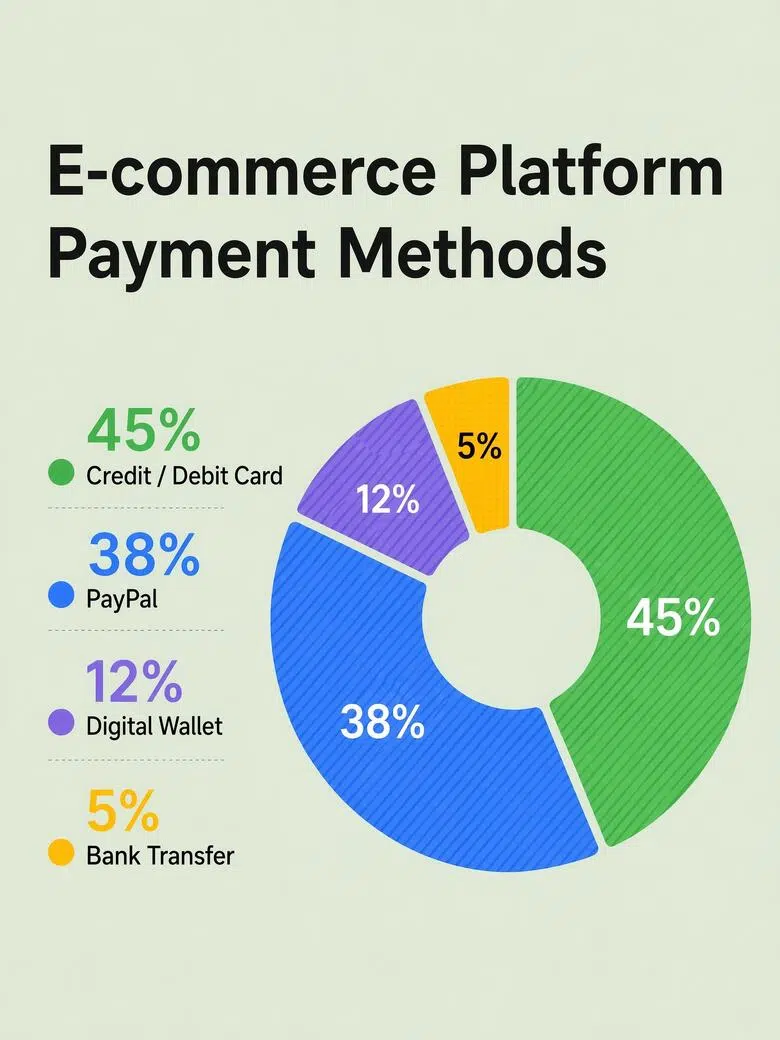
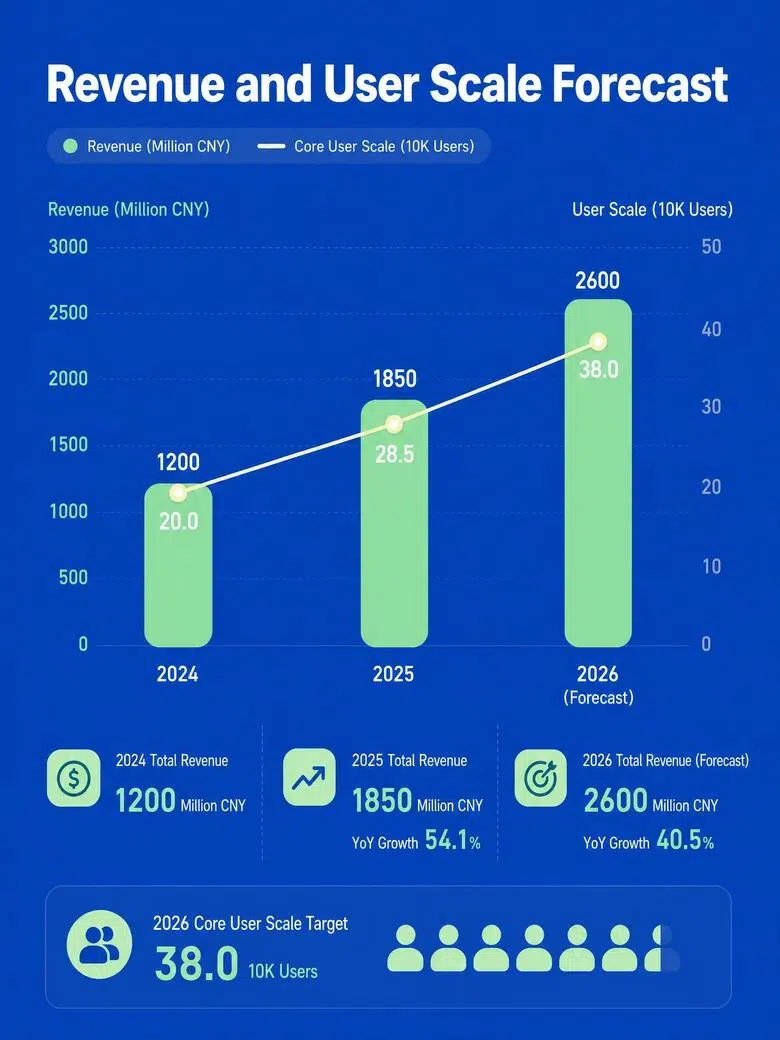
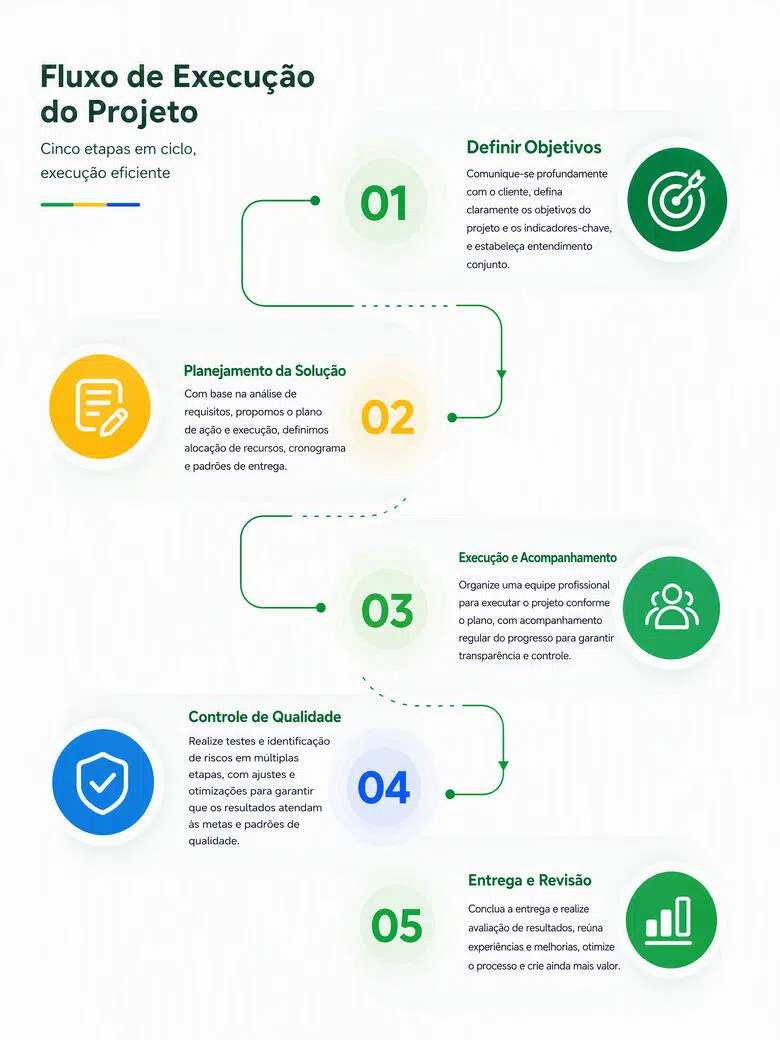
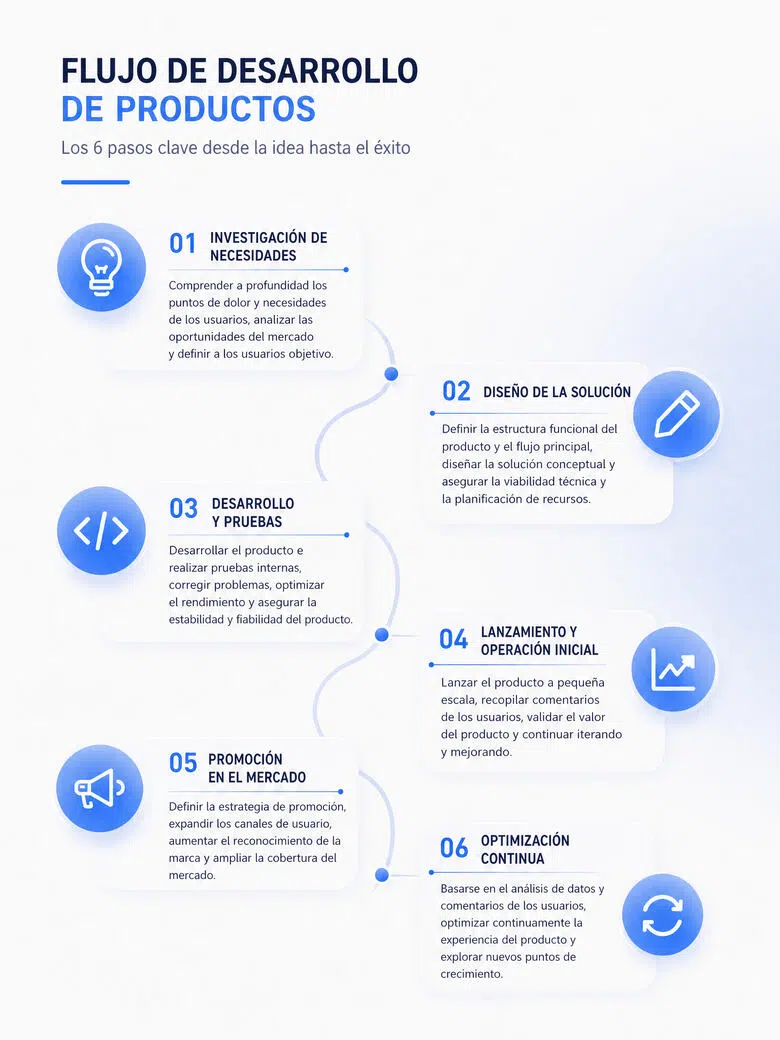
High-Quality Results
Explore More Skills
Continue exploring related Office Expert capabilities and turn your current task into a complete workflow.








Frequently Asked Questions
Do I need design skills or prompt-writing experience?
Can I keep editing after generation?
Yes. Generated results can be previewed, edited, and refined until they meet your needs.
Are my materials safe?
Materials are used only to complete the current task and are handled according to the platform’s data and privacy policies.
What can I use the results for?
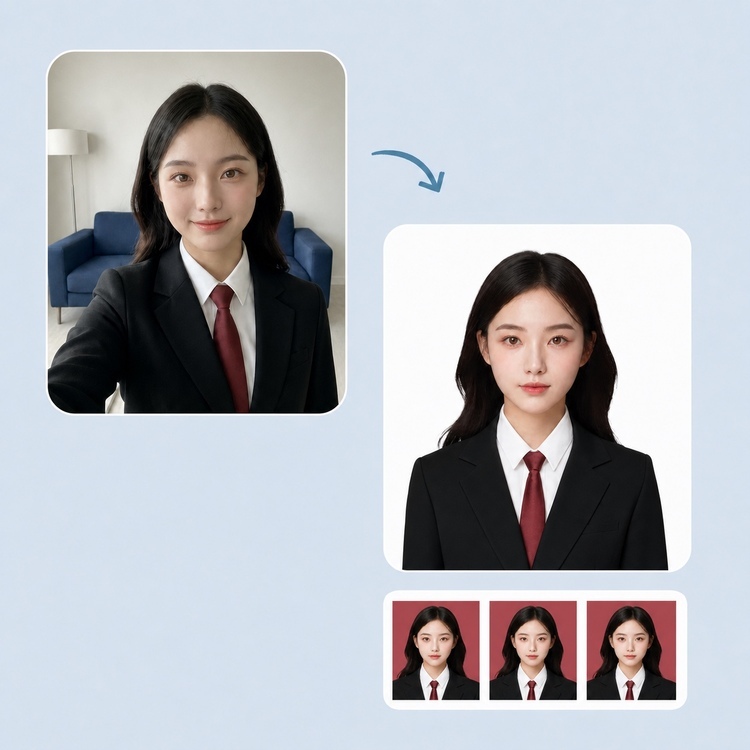
Use them for office communication, presentations, proposals, job applications, and other everyday work scenarios.